 on the right margin.
To see what others have said, click either the phrase “x comments” or the
on the right margin.
To see what others have said, click either the phrase “x comments” or the Rule Map–>New Consumer Tire Label–>DESIGN FORMAT
NHTSA tested 5 different label designs in consumer focus groups, varying in color, picture icons and orientation of the rating scale. See the
Test labels A-E. The groups “clearly preferred” Test Label B. Participants understood intuitively that red was poor and green was good; the horizontal format worked better than the vertical, which confused some participants.
NHTSA particularly requests comments on the order in which the ratings are presented. It proposes to place fuel efficiency first since that is the focus of EISA. However, focus group participants indicated that safety would be more important in their purchasing decisions — although the focus groups did not show a clear preference for any particular ordering on the label.
The required label would be paper, or plastic, and affixed to the tire. Font size: 14 pt for headings; 12 pt for rating scale labels. Overall size: at least 4.5 in. high by 5.5 in. wide. NHTSA believes this is the smallest legible size, but particularly requests comments on this.

The actual label NHTSA proposes makes several changes Test Label B that was preferred in the focus group. These changes include:
- Add a heading “Government Tire Ratings”: participants wanted to know this is a government program
- Add “Greenhouse Gas Rating” to “Fuel Efficiency”: The Energy Independence & Security Act requires that the rating system reflect fuel economy and greenhouse gas emissions over the life of the automobile
- Include “Wet Traction” with Safety Rating, and “Tread Wear” with Durability Rating to be more precise about which safety and durability characteristics are being rated
- Change the explanation of the ratings to replace “highest” with “best,” since for some of the data underlying the ratings (e.g., wet traction) a higher number produces a worse rating.
- Delete indicator of “average” rating, since this is unknown in advance of a complete database of all tire models. Also, some consumers are confused if the “average” indicator appears at different relative locations in each of the three scales.
Given the decision to delete the “average” indicators, NHTSA particularly requests comment on whether and how to indicate the best-rated tires for fuel efficiency. As the scale is currently proposed (see rating formulas), the most fuel efficient existing models would rate in the 80s. Specifically, the agency asks:
- Should the label designate the range of the top 25% of tires?
- Ought a tire also meet certain minimum safety and durability ratings before earning this designation?
- How could such a designation avoid misleading consumers that this as an Overall rating? (see rating formulas)
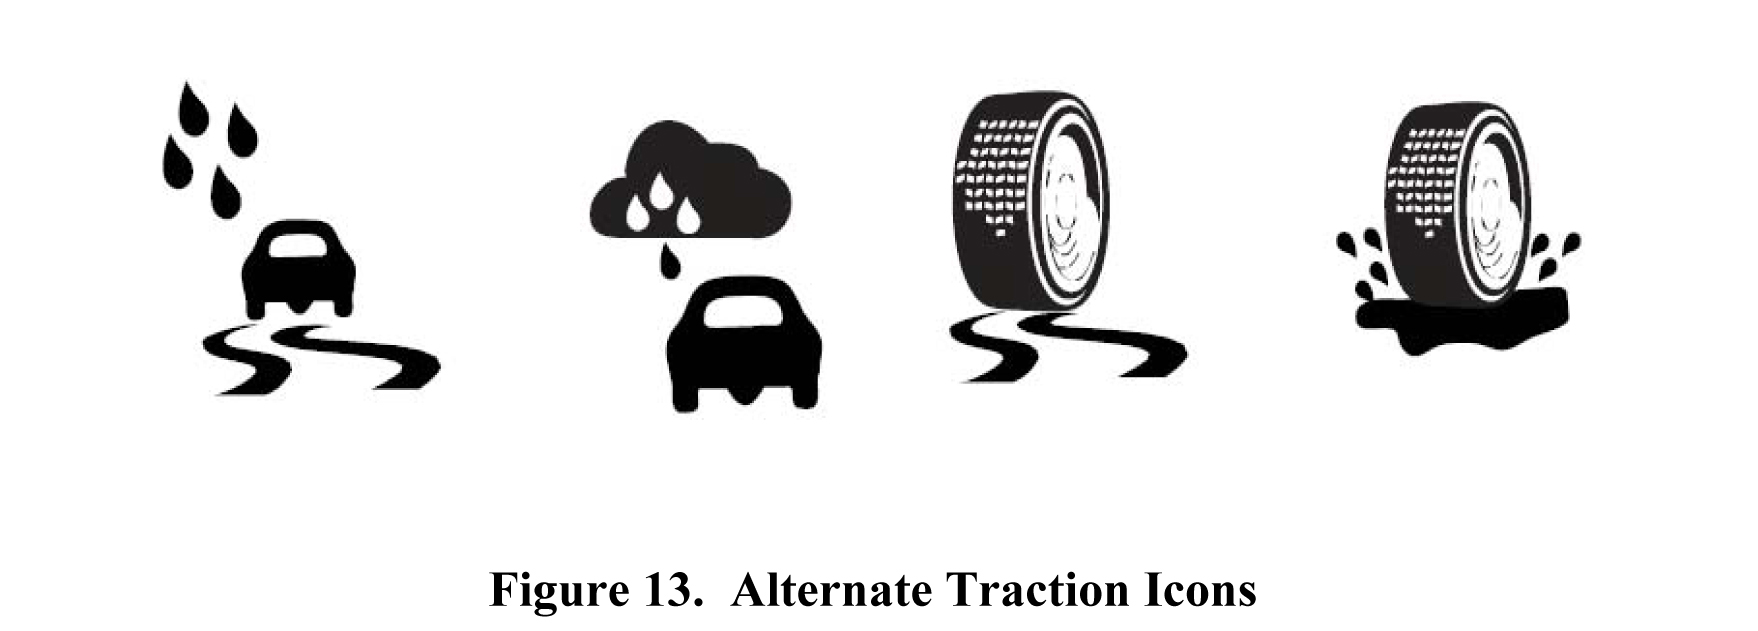
Many focus group participants found the symbol for wet traction confusing (e.g., some thought the cloud was a cowboy hat). NHTSA particularly requests comment on an alternative wet traction design.
Possible “wet traction” icon alternatives:
NHTSA particularly requests comment on whether the label should contain any of the following:
- A caution that the ratings apply only to properly inflated tires
- A caution that the ratings apply only to new replacement tires
- A restatement of the date of manufacture information currently within the tire identification number (TIN), which many consumers have complained is difficult to interpret. Possible format: “made in week XX of year YY” where xx and yy are the numbers now in the TIN
Tags: design